
Analyze the information
In this lesson, we'll work on analyzing and communicating the meaning of a graph.
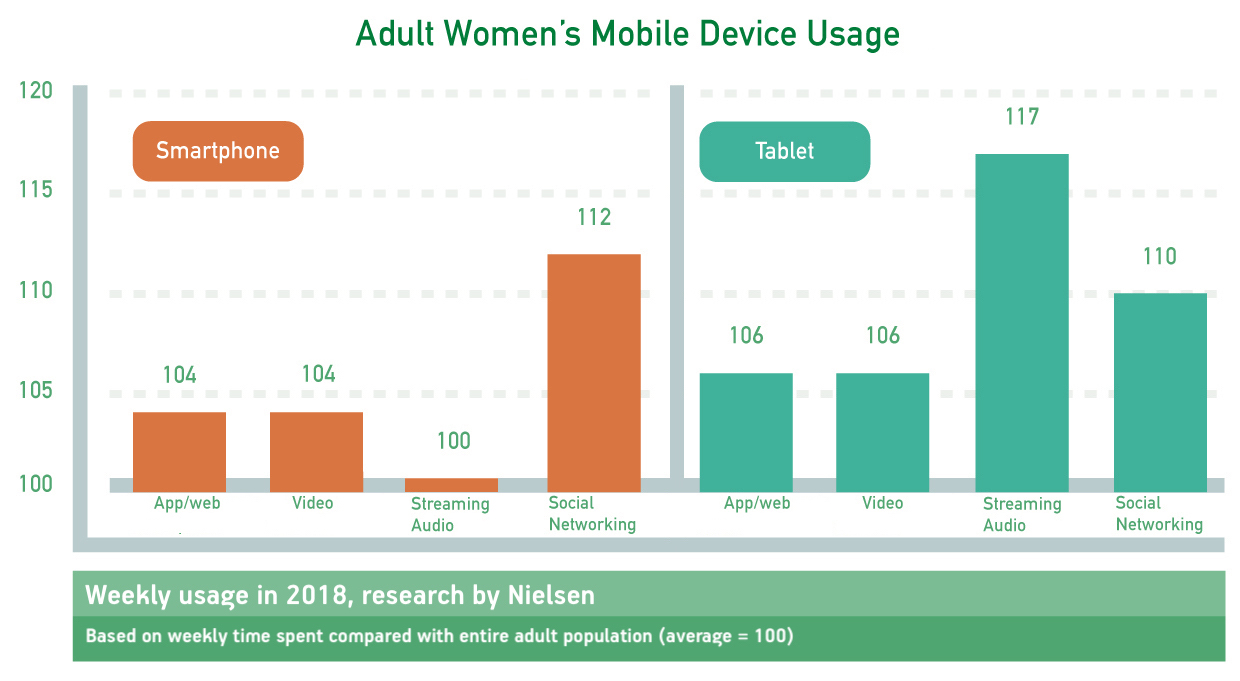
Here is a graph you have seen before. How could this information be used by tech manufacturers and social media services?
Imagine you work for a social networking company.
What would be the key points of the graphs? How would you use that information?
A. Meaning
Here are some useful phrases:
- ...which means that...
- That could mean...
- That obviously means...
Imagine you work for a company that manufactures tablets. Look at the following takeaways from the graph. What would they mean for a tablet manufacturer?
- Compared with the average population, women were 17% more likely to use tablets to stream audio.
- Women watched videos on tablets slightly more than on mobile devices.
B. Cause
Here are some useful phrases:
- This is probably because...
- I believe the reason is...
- This could be due to...
Look at the following takeaways from the graph. Can you imagine a cause of the trend?
- Women prefer to use tablets to stream audio.
- In general, women use social networking far more than the average person.
Look at the graphs below. Imagine you work for a videogame company. Use the skills you have learned to talk about the main takeaways, the meaning and the cause.
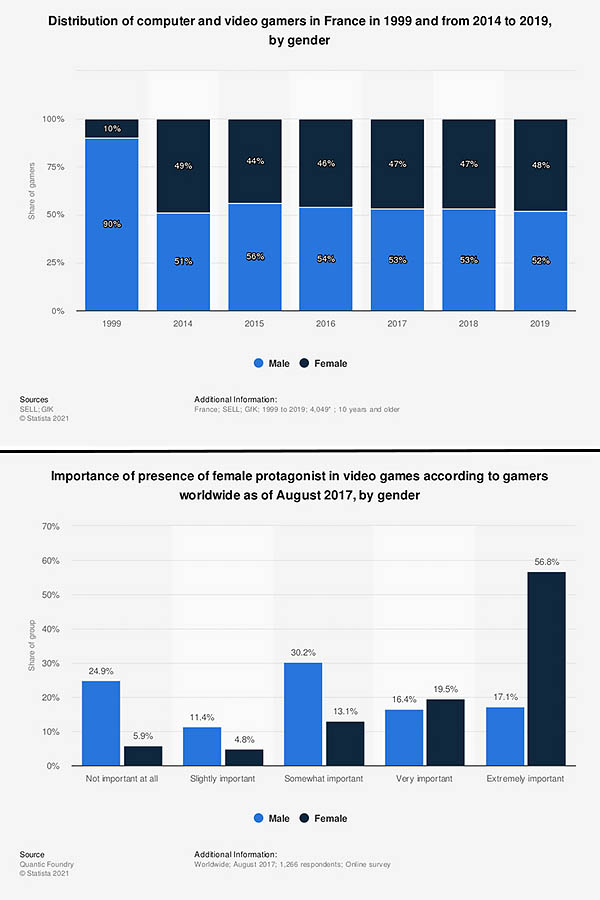
[For more on these graphs, see this discussion post from The English Farm: "Visuals: Computer games heroes"]